eland.Series.hist
-
Series.hist(by=None, ax=None, grid=True, xlabelsize=None, xrot=None, ylabelsize=None, yrot=None, figsize=None, bins=10, **kwds)¶ Draw histogram of the input series using matplotlib.
See pandas.Series.hist for usage.
Notes
Derived from
pandas.plotting._core.hist_frame 0.25.3Examples
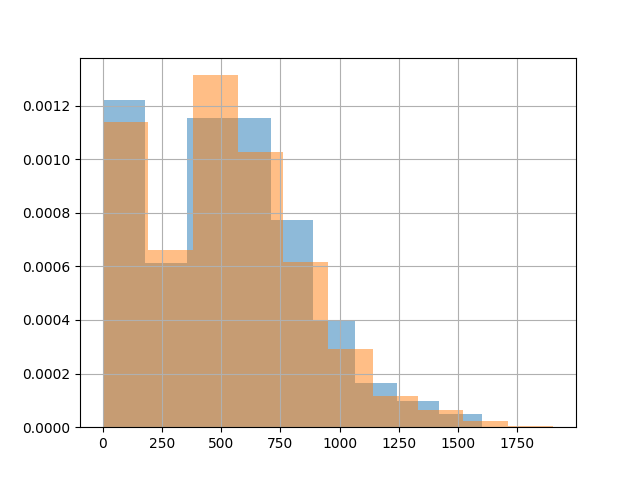
>>> import matplotlib.pyplot as plt
>>> df = ed.DataFrame('localhost', 'flights')
>>> df[df.OriginWeather == 'Sunny']['FlightTimeMin'].hist(alpha=0.5, density=True) # doctest: +SKIP
>>> df[df.OriginWeather != 'Sunny']['FlightTimeMin'].hist(alpha=0.5, density=True) # doctest: +SKIP
>>> plt.show() # doctest: +SKIP