eland.DataFrame.hist
-
DataFrame.hist(column=None, by=None, grid=True, xlabelsize=None, xrot=None, ylabelsize=None, yrot=None, ax=None, sharex=False, sharey=False, figsize=None, layout=None, bins=10, **kwds)¶ Make a histogram of the DataFrame’s.
See pandas.DataFrame.hist for usage.
Notes
Derived from
pandas.plotting._core.hist_frame 0.25.3Ideally, we’d call the pandas method hist_frame directly with histogram data, but weights are applied to ALL series. For example, we can plot a histogram of pre-binned data via:
counts, bins = np.histogram(data)
plt.hist(bins[:-1], bins, weights=counts)
However,
ax.hist(data[col].dropna().values, bins=bins, **kwds)
is for
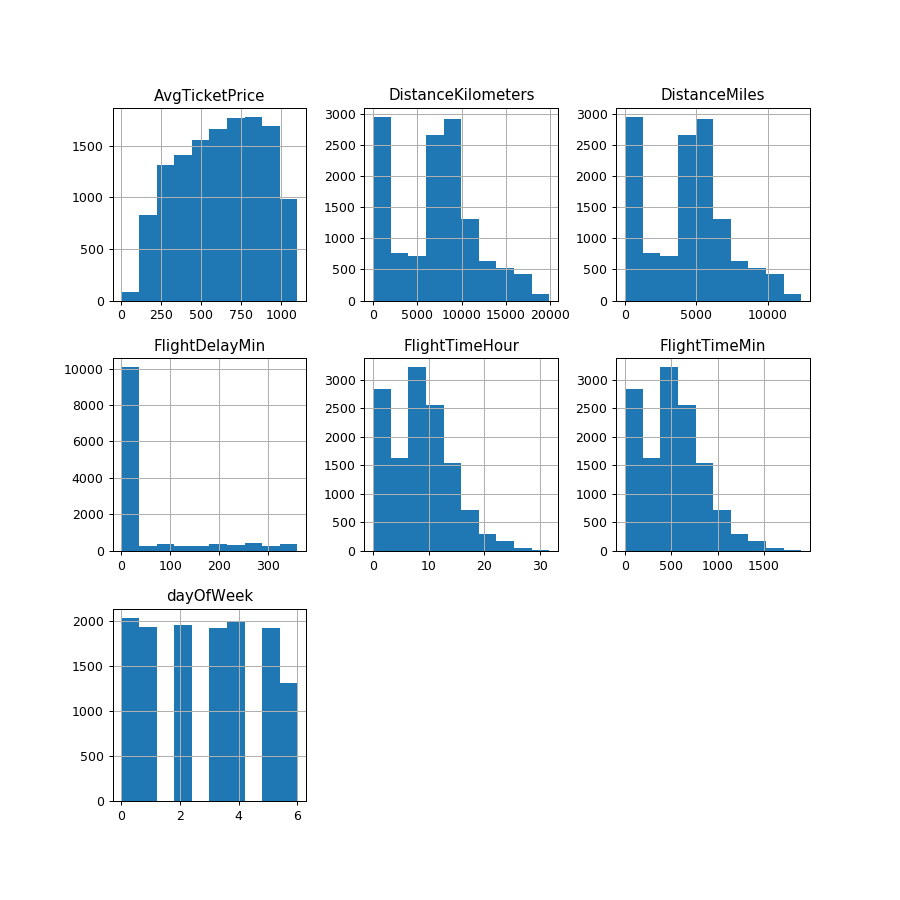
[col]and weights are a single array.Examples
>>> df = ed.DataFrame('localhost', 'flights')
>>> hist = df.select_dtypes(include=[np.number]).hist(figsize=[10,10]) # doctest: +SKIP